Source Trinity River Restoration Program

Current Restoration Flow Release Schedule
B120 forecasts were released by the California Department of Water Resources on February 8 and March 8, 2023. Under TRRP’s Winter Flow Variability plan, this allowed scheduling 60,000 acre feet of release from Lewiston Dam, above the winter base-flow level, for the February 15 – April 15 period, then an additional 60,000 acre feet for the March 15 – April 15 period.
The April B120 forecast was posted April 10, 2023, with an inflow of 1,620,000 acre-feet (50% level), which determined the water-year type for the TRRP volume as “Wet”. The TRRP flow schedule that has been approved by the TMC for a Wet year is still pending final approval by the U.S. Department of Interior.
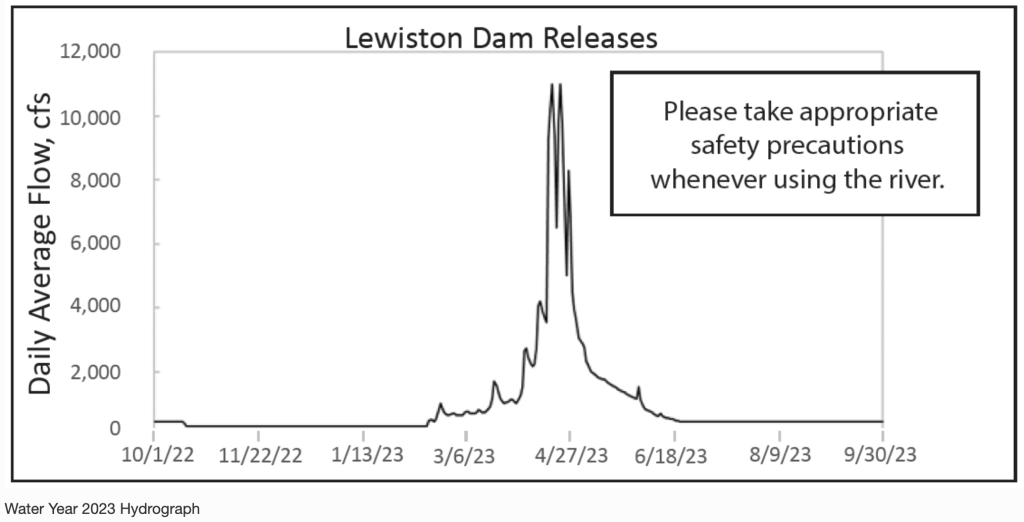
This flow schedule includes two peaks at 11,000 cfs from Lewiston Dam within April (although both are so brief that the daily average release will be lower).
An image of the hydrograph is provided below, along with a link to download a flyer that includes the daily-average schedule.
Most data shown here are from the USGS via the waterservices site, plus the USBR and CDWR via the California Data Exchange. Data are provisional and may be recalculated before final approval. The TRRP site checks for new sub-daily values every 15 minutes and for new daily values twice per day. Note that “Full Natural Flow” is an automated estimate from CDWR of the flow that would naturally pass the Trinity Dam site if unimpeded – it is very sensitive to small variations in lake level measurements that may result in negative values when flows would naturally be low, but is more useful for storm events, snowmelt, and averages over longer times. The graphic for water released to the Trinity River versus the water diverted to the Central Valley tends to show higher values for the river until summer, when water exports to the Central Valley typically increase. Click here for a summary of Trinity River flow volumes.
CDWR Apr. B120 forecastdetermines restoration total volume.
Wet-WY23_APR16-May18_SpringReleaseFlyer water-year-2023-proporti-1 water-year-2023-progressForecast is released about the 10th.
| Parameter Linked to TRRP data viewer | Location Linked to TRRP online map | Time Measured | Value Linked to Source Website |
|---|---|---|---|
| Flow | Trinity River above Coffee Creek | 2023-04-11 03:30:00 PDT | 1430 cfs |
| Full Natural Flow (estimated daily average) | Trinity Dam | 2023-04-09 (daily) | 2931 cfs |
| Diversion Flow (daily average) | DIVERSION: To Whiskeytown Lake and the Central Valley, from Lewiston Lake via Clear Creek Tunnels and Carr Powerhouse. | 2023-04-09 (daily) | 26 cfs |
| Flow | Trinity River at Lewiston, Gage | 2023-04-11 03:45:00 PDT | 3350 cfs |
| Flow | Trinity River below Limekiln Gulch | 2023-04-11 03:30:00 PDT | 3440 cfs |
| Flow | Trinity River at Douglas City, Gages | 2023-04-11 03:00:00 PDT | 4160 cfs |
| Flow | Trinity River at Junction City | 2023-04-11 03:45:00 PDT | 4840 cfs |
| Flow | Trinity River above North Fork Trinity | 2023-04-11 03:45:00 PDT | 5470 cfs |
| Flow | Trinity River near Burnt Ranch | 2023-04-11 03:45:00 PDT | 8480 cfs |
| Flow | Trinity River at Hoopa | 2023-04-11 03:00:00 PDT | 18900 cfs |
- CalFire PR: BURN PERMITS REQUIRED May 1, 2024
- Wildfire Season Is Almost Here! Can One State’s Problem Be Another State’s Solution?
- EPA conducted Rotenone experiments on Klamath Basin?
- The Klamath River September 2002 Fish Die-off : Older Fish from Trinity River Hatchery Affected
- Where did the Sockeye Go From The Klamath ?? Will they return without the dams ?


Leave a Reply