

In the heart of rural America, a contentious battle over water rights is unfolding in the Scott River watershed. The recent notice from the State Water Resources Control Board, while seemingly well-intentioned, raises serious questions about the efficacy and fairness of current water management practices, especially when viewed through the lens of historical data.
The Board’s decision to temporarily suspend curtailments hinges on a critical threshold: a flow rate of 35 cubic feet per second (cfs) at…
Partner Ads By Google


2 Comments
Glad you’re raising these points, Jay! Community leaders have been questioning the relevance of the State Water Board’s flow minimums since they were proposed in Spring 2021, but to no effect, sadly. Actually, their required flow for August is 30 cfs and for September 33 cfs, as their adopted regulations state. Where this new 35 cfs expectation after 9/1 came from is a surprise.
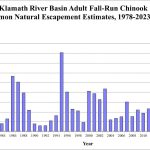
The current situation is an odd one, with flows bottoming out at 15.8 cfs on August 17th and then rapidly increasing to over 30 cfs by 8/24. This steep increase in August contrasts with the average decline, even with some rain. Flow at the tailings reach above Fay Lane is apparently reconnected, which is also unusual for this time of year. While this unexpected flow increase is appreciated, we need to look at multiple factors that could help us understand why this has happened this year and not other years. Some may argue it’s because of the 3,000 acre-feet of artificial groundwater recharge that occurred this past winter by Scott Valley Irrigation District on the eastside fields, which could seep into the river months later. Others may assert that it was caused by the State Water Board’s curtailment orders last month and its reduced groundwater pumping regulation. Is it increased supply and/or reduced demand?
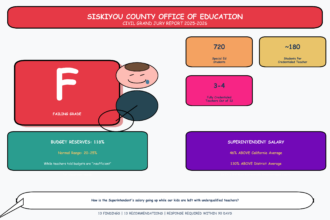
It would sure help if an objective assessment could be done sooner than later, as Scott Valley’s farming is on the cutting edge of the State’s approach to groundwater management, with field-by-field regulation of water use that is not being applied anywhere else in California. Farming and ranching families and Siskiyou County all say it’s hurting our local economy. We should all be demanding some trust-worthy answers.
What can citizens of Siskiyou County do? Is there a petition to sign? Email our representative and senators?